
Your team shouldn’t rebuild the same reports every month.
Every month, your team pulls data, checks figures, updates slides, prepares commentary and sends reports.
As your client base grows, those tasks take up hours of specialist time. We automate report preparation so your team can review the finished reports before they’re sent.
Turn report production into a review workflow.
Specialist reporting time saved
Reporting production time reduced
Reporting production workflow
Specialist time returned on a monthly reporting cycle
Automate the repetitive work before the report reaches your team.
Data collection, preparation, checking and formatting can happen automatically, so your team spends its time reviewing performance, adding context and making decisions.
Reporting grows with every client. Your team’s capacity doesn’t.
Every account creates another cycle of data collection, checking, formatting, commentary preparation and delivery.
Across ten, twenty or fifty clients, those repeated steps add up fast and pull experienced people into work that should already be handled by the system.
Teams still pull figures from ad platforms, analytics tools, spreadsheets and CRM systems.
Teams still pull figures from ad platforms, analytics tools, spreadsheets and CRM systems before the real reporting work can begin.
The same numbers get checked again every reporting cycle
Dates, spend, conversions, totals and anomalies are repeatedly reviewed by hand across multiple client accounts.
Reports still need assembling, formatting and updating
Slides, tables, charts and commentary sections are rebuilt or refreshed every month, even when the structure barely changes.
Experienced people end up carrying the production workload
Account managers and channel specialists spend valuable time preparing reports instead of interpreting performance and deciding what happens next.
Stop rebuilding reports every month.
Turn repetitive data preparation, checking and formatting into a controlled workflow your specialists can review and approve.
Move from rebuilding reports to reviewing performance.
Replace repeated exports, checks, formatting and assembly with a workflow that prepares the report automatically before your team gets involved.
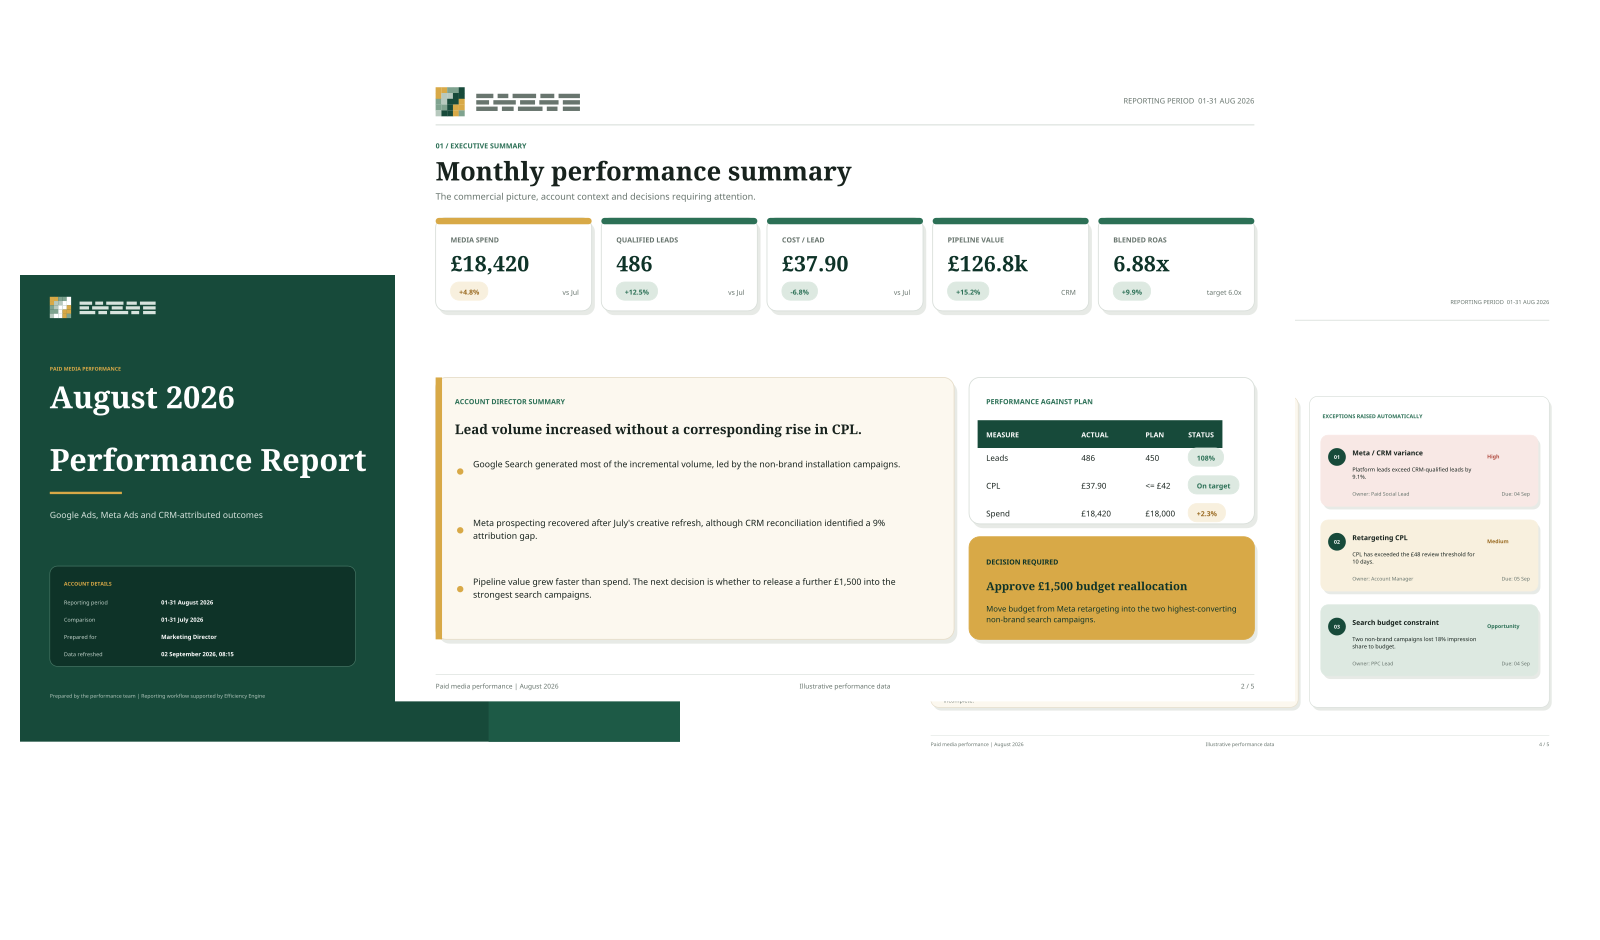
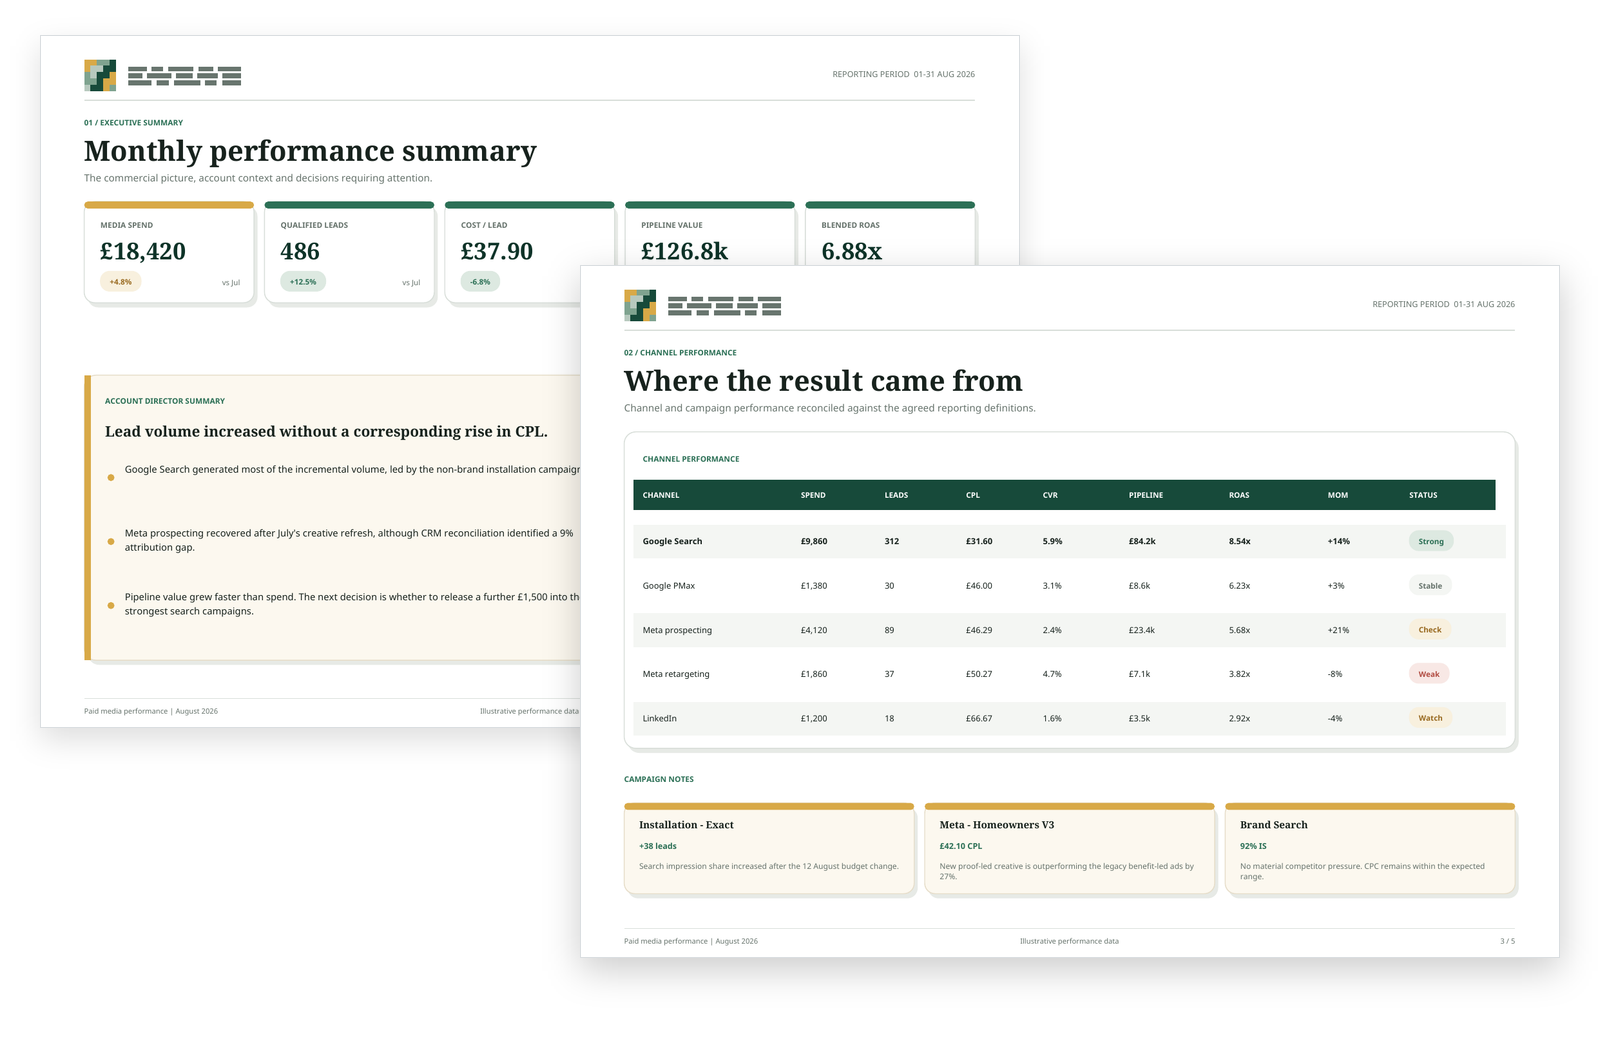
A complete client report, prepared before review begins.
The system prepares the report automatically and flags anything that needs a specialist’s attention.
From platform data to a client-ready performance report.
Performance data is collected, checked and structured into a consistent report before specialist review begins.
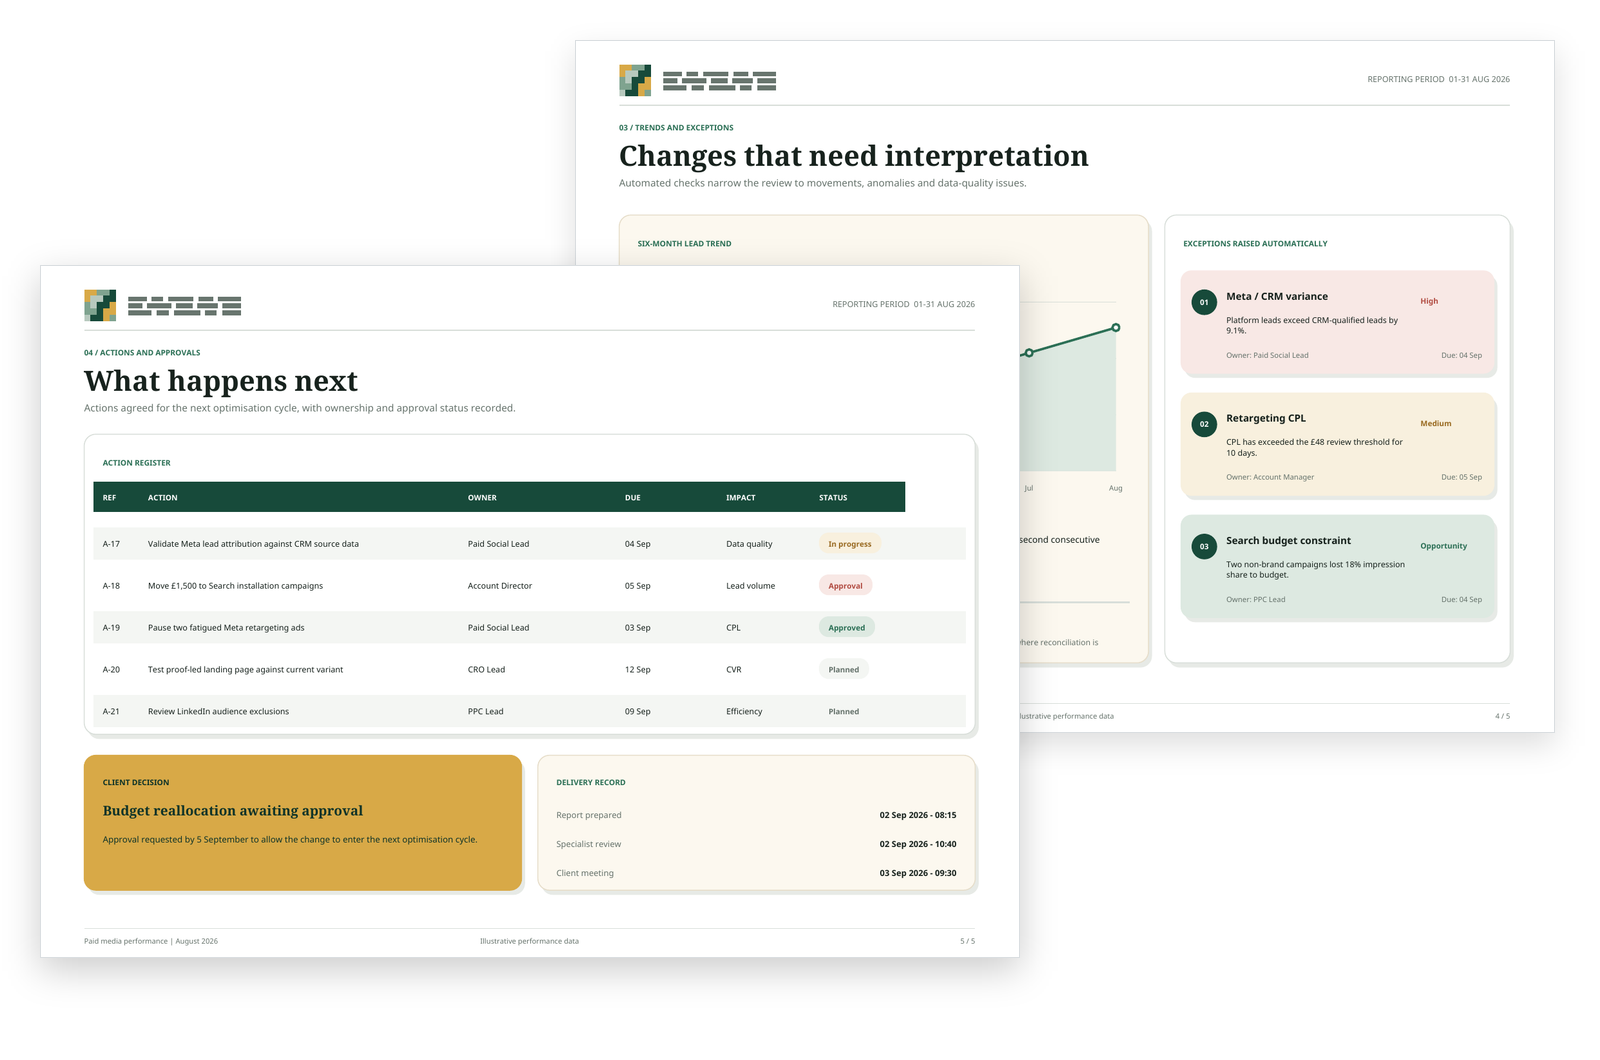
The report shows your team what needs attention next.
Automated checks flag important changes, anomalies and data quality issues. The report links these findings to recommended actions and shows who is responsible and when each action is due.
Reporting stops draining specialist time every month.
Automate the production work around recurring reports so account teams spend less time collecting, checking and assembling information — and more time using it.
More Delivery Capacity
Recover hours currently spent collecting data, checking figures and assembling recurring reports.
Faster Reporting Cycles
Prepare recurring reports faster by automating the steps your team repeats each month.
More Consistent Outputs
Apply the same structure, checks and preparation process across every client and every reporting period.
Fewer Manual Errors
Reduce repeated copying, spreadsheet handling and last-minute corrections across the reporting process.
More Useful Client Conversations
Give specialists more time to interpret performance, add context and discuss what should happen next.
Reporting That Scales
Add clients without increasing reporting workload at the same rate or pushing more production work onto the team.
We map the reporting workflow before we automate it.
First we understand where the data comes from, what gets checked, how reports are assembled and where specialist judgement is needed. Then we automate the repeatable steps around that process.
Map the current reporting workflow
Identify where data comes from, what gets checked, how reports are assembled and where time is currently being spent.
Define what can be automated
Separate repeatable production work from the analysis, judgement and client context that should stay with your team.
Build and connect the workflow
Connect the data sources, automate preparation and checks, and create the reporting output your team will review.
Put it into live client delivery
Test it with real accounts, refine the handoff points and make the workflow part of the normal reporting cycle.
Map the current reporting workflow
Identify where data comes from, what gets checked, how reports are assembled and where time is currently being spent.
Define what can be automated
Separate repeatable production work from the analysis, judgement and client context that should stay with your team.
Build and connect the workflow
Connect the data sources, automate preparation and checks, and create the reporting output your team will review.
Put it into live client delivery
Test it with real accounts, refine the handoff points and make the workflow part of the normal reporting cycle.
15+ years of reporting, analytics and campaign delivery shapes how these systems are built.
I’ve built reports, analysed campaign performance, worked with GA4 and paid media data, and spent years turning platform numbers into something clients and account teams can actually use.
That experience helps me spot gaps in reporting and tasks where teams still have to pull figures together manually. I also look for business context that gets lost when data comes from different platforms.
The result is a reporting workflow that automates the repetitive work while keeping analysis, context and client decisions with the people who understand the account.

Jaimie Creek
Founder
Common questions about reporting automation.
We define the source-of-truth data, calculation rules and reporting logic before the system is built. Automated validation checks can flag missing data, unusual movements and reconciliation issues. The completed report remains subject to specialist review and approval before client delivery.
Yes. The production process can be standardised while each client retains the KPIs, channels, layouts, benchmarks and commentary relevant to them. Automation removes repeated production work; it does not force every client into identical reporting.
Usually not. Existing tools that already serve your agency can remain in place. The reporting workflow is built around them to reduce copying, formatting, repeated checks and the manual preparation required before the report is ready for review.
No. The system removes repetitive production work such as gathering data, checking figures and formatting reports. Your specialists retain responsibility for interpretation, client context, recommendations and final approval.
Only the access required for the agreed reporting workflow. Wherever possible, the system uses controlled user permissions or platform connections rather than shared passwords. Access requirements, data sources and responsibilities are agreed before the build begins.
Ownership is defined by the engagement you choose. With an ownership implementation, the dashboards, workflows, scripts, documentation and agreed access are handed over to your agency. Managed arrangements can include ongoing operation, maintenance and support.
The reporting workflow is designed to be maintained as platforms, data sources and client requirements change. Updates can be made to connections, calculations, checks, report structures and outputs, with ongoing maintenance available where required.
A typical implementation runs across five weeks: workflow mapping and architecture, system build, testing with real reporting data, refinement, documentation and team handover. The exact scope depends on the number of platforms, clients and reporting variations involved.
Stop rebuilding the same reports every month.
Map the reporting work your team repeats, identify the production steps that can be automated and recover more specialist time for analysis, decisions and client delivery.